
This week Limassol hosted the 8th MedCLIVAR conference (21-25 September), a gathering of climate scientists working on the Mediterranean. I managed to attend one day of the event before I got sick and that made me unable to attend more. However, the day was full of sessions covering heatwaves, crops, schoolyards, migration and how climate science gets communicated.
The first sessions of MedCLIVAR 2026 were a snapshot of how scientists are trying to understand a Mediterranean that is heating up faster than the rest of the world. Researchers from across the region talked about heatwaves: how often they happen, how hot they get, where the extra heat comes from, and how well computer models can reproduce them.
Testing the tools we use to see the future
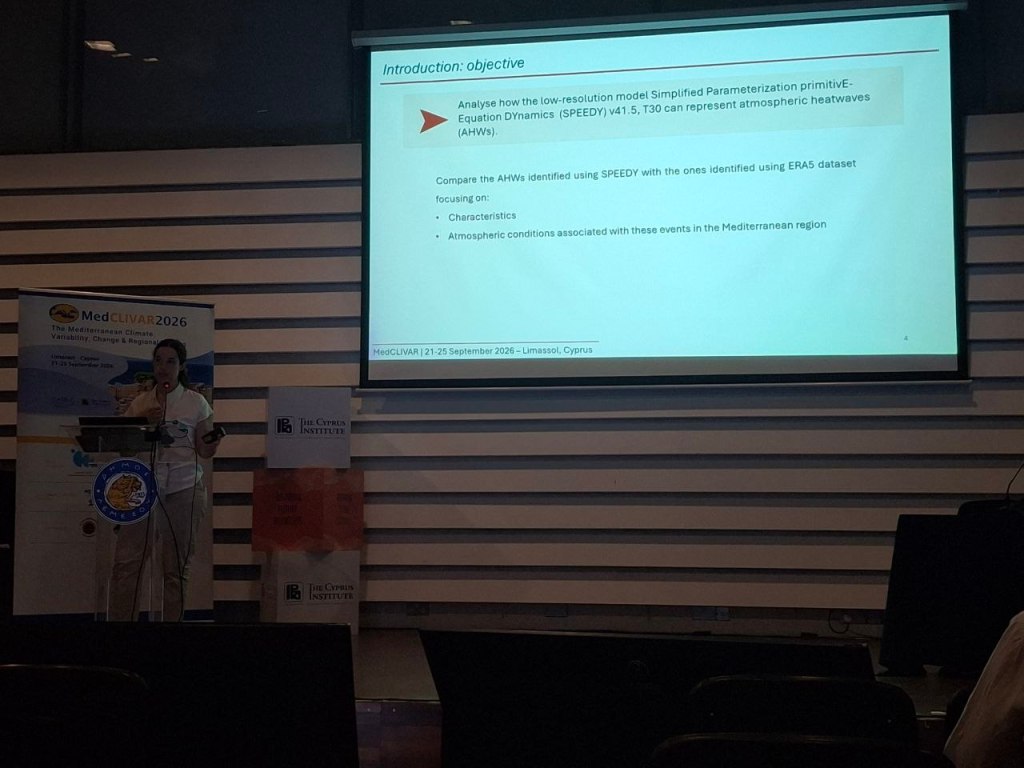
Laura Paredes-Fortuny (University of Barcelona) asked whether a deliberately simple, low-resolution climate model can reproduce heatwaves. Heatwaves are statistically rare, and cheap models can be run for 500 simulated years, giving far more examples to study. Her conclusion was that the model captures heatwaves driven by large-scale atmospheric patterns reasonably well, but struggles where mountains, coastlines and small islands matter. Knowing where a tool works, and where it doesn’t, is part of making it trustworthy.
The heat is not just rising, it is accelerating
Aristotelis Liakakos, a joint PhD student at The Cyprus Institute and the National and Kapodistrian University of Athens, presented a new way to measure warm spells. Most existing indices capture some of a spell’s character, such as how hot it was or how long it lasted, but miss others. His index, the Warm Spell Magnitude Index daily (WSMId), combines magnitude, duration, frequency, spatial extent and seasonality. Older heatwave measures are tuned to midsummer and can under-count unusually warm spells in spring, autumn or winter.
Of the 40 largest warm spells identified in Europe and the Mediterranean (ten per season), 26 occurred in the last decade and 15 in the last five years. Milder categories of warm spell are now affecting most of the basin, severe and extreme ones are becoming much more widespread, and the very extreme categories are just beginning to appear in the record.
When “average” hides the danger
Pantelis Georgiades of The Cyprus Institute presented a machine-learning approach to a practical problem: heat stress depends on the timing and duration of heat and humidity, but most climate projections only provide daily values. His team trained a model to reconstruct hourly temperature and humidity from daily data, and validated it against reanalysis data. The point is easy to grasp: a day whose average sits below a hazardous threshold can still include several consecutive hours above it.
Applying the method to projections from eight climate models under four emissions scenarios, they mapped how many hours per year Mediterranean residents would face different levels of humid heat. Exposure shifts toward the “great discomfort” and “dangerous” categories, with the gap between scenarios widening after mid-century. Life-threatening conditions stay rare but rise sharply under high emissions. Which path we take matters most in the second half of the century.
Not all heat is the dry
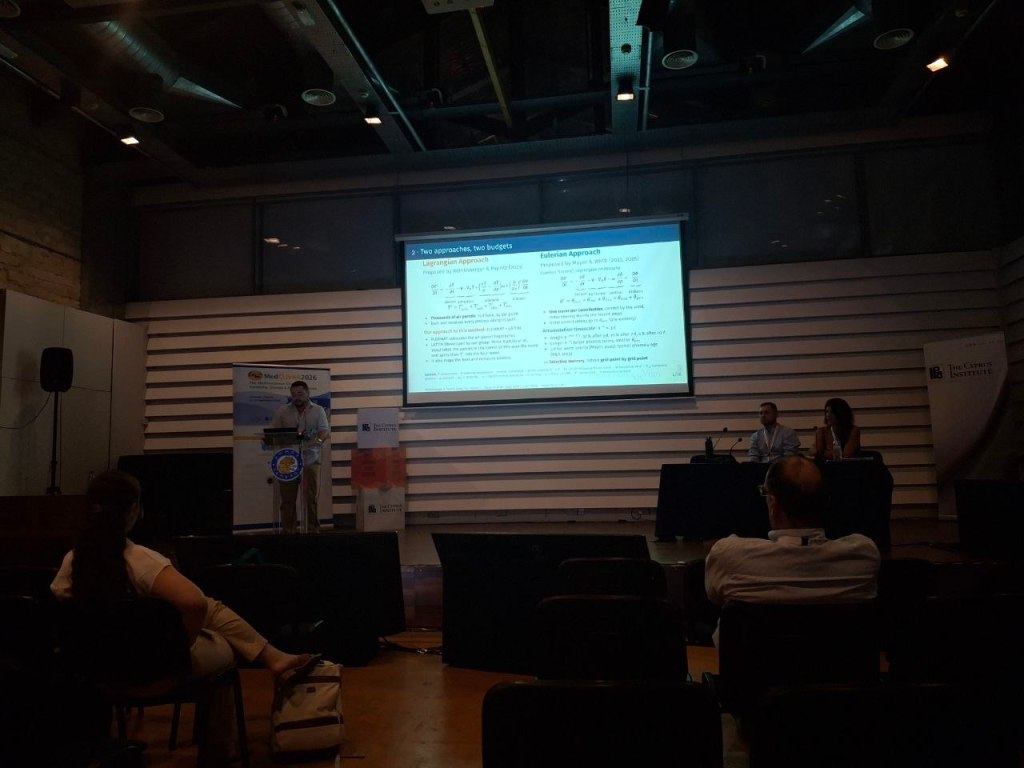
Jorge Eiras-Barca and colleagues from the University of Vigo looked at a single event in detail: an 11-day humid heat-stress episode in eastern and southeastern Spain in August 2015. It was linked to an estimated 260 heat-attributable deaths, yet it never made the official list of Spanish heatwaves. It is a reminder that dangerous heat does not always look like the classic scorcher.
The team compared two ways of asking where a heat anomaly comes from. Their two methods agreed closely on how the temperature anomaly evolved day by day. They found that the usual cooling influence of air arriving from the Atlantic had failed, because the Atlantic flow was steered north of Iberia, while warm, humid air came in from the Alborán Sea and North Africa. The two methods disagreed on one component, the heating from the surface and mixing, and the team is investigating why. They also noted that one of the two methods is available as a global 1980-2022 dataset they are offering to share with other researchers.
The mornings sessions at the Room A were finalized with the presentation by Mostafa Awatif presenting comprehensive diagnostic, statistical prediction and numerical model evaluation of seasonal climate variability and predictability over Egypt.
Heat, migration and the wider system
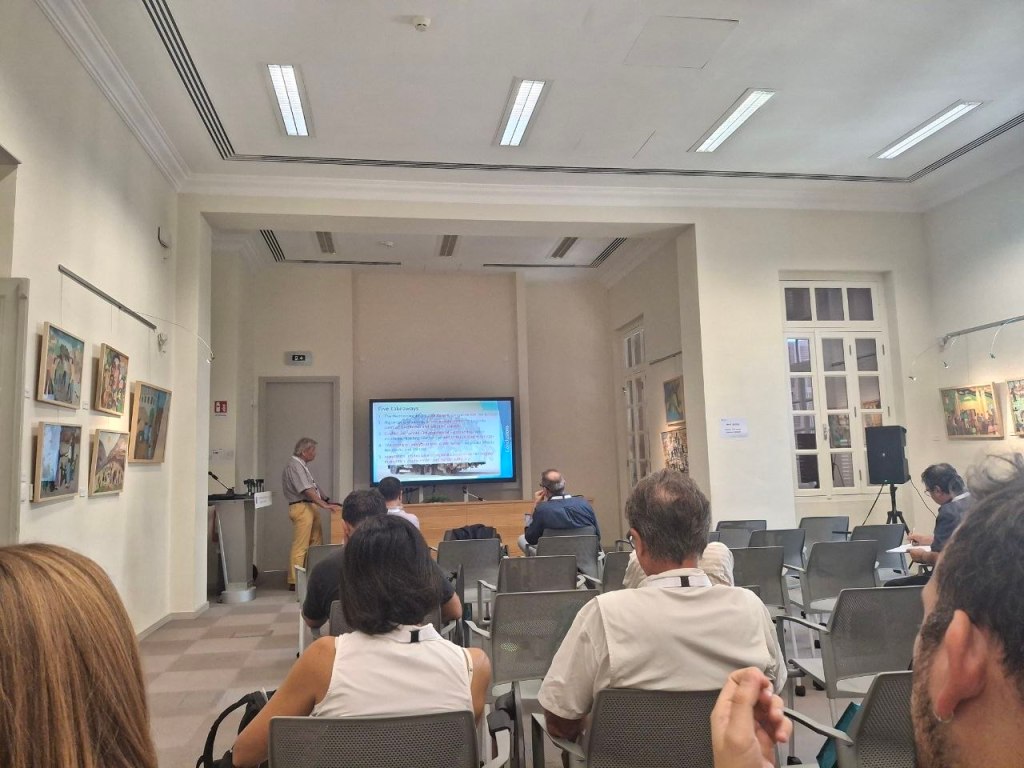
After a coffee break I moved to the Limassol Municipal Library (one of the most beautiful buildings in Limassol in my opinion) where the first session started by Manfred Lange of The Cyprus Institute who presented work with the MedECC network on how environmental change, migration and conflict interact. His message cut against simple narratives: environmental stress can act as a “risk multiplier”, but the evidence does not support a straightforward, universal link between climate and conflict or migration. Outcomes depend on exposure, vulnerability, livelihoods, institutions and the ability to adapt, and most displacement linked to shocks is internal rather than cross-border. He also stressed that some people are unable to move at all.
His recommendations for decision-makers were to think in systems, focus on vulnerability, treat mobility as varied, invest before a crisis and cooperate across borders. His summary line: manage the system, not the symptoms. A new MedECC expert analysis on the topic was announced.
Then the floor was taken by Adriana Bruggeman, Associate Professor of Hydrology and Water Management in the Cyprus Institute who presented how the changing climate affects nitrate leaching in olive orchards irrigated with treated waste water.
On the farm and in the schoolyard
Wheat. Padmavathi Bevara and Ehud Strobach modelled Italian wheat, comparing 1980-1989 with 2014-2023. The wheat-growing season warmed by about 1.78°C, and simulated yields fell from 5.20 to 4.39 tonnes per hectare, a drop of roughly 8.7% per degree of warming. That is in line with earlier published estimates. The largest reductions appeared in the south and on the islands, though the model performs less well in southern Italy, so the regional detail deserves caution.
Schoolyards. Anastasija Dukic (Politecnico di Milano) and Ravi Kumar Pandey (The Cyprus Institute) presented a baseline study of a primary school in Nicosia, part of the EU-funded RE-ACT Schools project, which aims to turn paved yards into green, multi-purpose spaces. Their simulation of one July day found that what matters most to a child is not air temperature but radiant heat from the sun and hot surfaces. At 14:00, air temperature varied by about 2 degrees across the yard, but radiant temperature varied by more than 33. The simulated radiant peak reached 53.8°C at 17:00, while air temperature peaked at 28.2°C. The implication is that shade is likely the first priority. The presenters were careful to stress that these are simulated values still awaiting comparison with on-site sensors, and that no intervention has yet been tested.
Researchers are actively sharing data and methods and inviting collaboration, and that, along with practical steps like shading a schoolyard, is where this research meets everyday life.


Leave a comment